Descriptive analytics is the starting point for most data work: it tells you what has happened by summarising raw data into clear, usable signals. Before you run predictive models or optimisation, you typically need to understand distributions, typical values, variability, and whether the data contains unusual points. One of the most practical tools for this stage is the Z-score, a standardisation method that converts values from different scales into a common unit: “how many standard deviations away from the mean is this value?” This is exactly the kind of technique learners apply early in a data analytics course in Bangalore, because it supports quick comparison, anomaly detection, and consistent reporting across metrics that otherwise do not align naturally.
What descriptive analytics actually delivers
Descriptive analytics focuses on summarising data rather than forecasting it. The most common outputs include:
- Central tendency: mean, median, mode
- Spread: standard deviation, variance, range, interquartile range
- Shape: skewness (leaning left/right), kurtosis (tail heaviness)
- Frequency patterns: counts, percentages, histograms, category breakdowns
- Outliers: values that appear inconsistent with the majority
These summaries help you answer practical questions: Are most transactions clustered tightly or widely spread out? Is there a “typical” delivery time, or does it vary heavily by region? Are a few customers generating most complaints?
However, descriptive analytics runs into a common issue: many datasets contain variables on different scales. For example, “monthly revenue” could be in lakhs, “delivery time” in minutes, and “customer rating” on a 1–5 scale. Comparing raw values directly is misleading. This is where standardisation becomes essential.
Z-score fundamentals: the standardisation logic
A Z-score converts a raw value into a standardised value using the mean and standard deviation of its dataset:
Z = (x − μ) / σ
Where:
- x = the data point you are evaluating
- μ = mean of the dataset (average)
- σ = standard deviation of the dataset (typical spread)
Interpretation is straightforward:
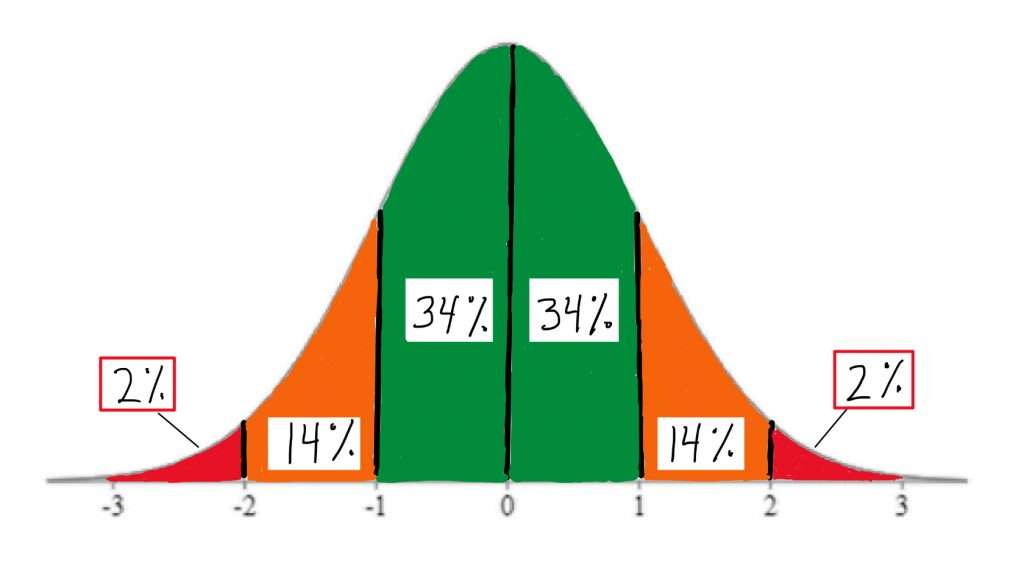
- Z = 0 means the value equals the mean.
- Z = +1 means the value is one standard deviation above the mean.
- Z = −2 means the value is two standard deviations below the mean.
In many real-world analytics workflows, Z-scores are used to flag unusual observations. A common rule of thumb is that values beyond ±3 are rare under a roughly normal distribution, making them candidates for investigation (not automatic “errors,” but “review-needed” points). Learners in a data analytics course in Bangalore often use this to build simple anomaly dashboards before moving to more complex detection methods.
How to calculate Z-scores in a clean workflow
A reliable Z-score calculation depends on correct descriptive statistics and clean data handling. A practical workflow looks like this:
Step 1: Validate and clean the variable
Check for missing values, incorrect units, duplicates, and impossible entries. Z-scores amplify problems when the underlying mean or standard deviation is distorted.
Step 2: Compute mean and standard deviation
For a sample, many tools use sample standard deviation by default. Ensure consistency across tools (Excel, SQL, Python) so results match.
Step 3: Standardise using the formula
Compute the Z-score per row/value. In a spreadsheet, you’d subtract the mean from the value and divide by the standard deviation. In databases, you typically use window functions to compute mean/std over the relevant partition.
Step 4: Interpret using context, not only thresholds
A Z-score indicates unusualness relative to the dataset, not “good” or “bad.” For example, a Z-score of +2.5 in call duration might indicate an escalated customer case rather than an operational issue.
Practical use cases where Z-scores add immediate value
1) Outlier detection in operations
Suppose a logistics team tracks delivery times. If the average is 42 minutes with a standard deviation of 8 minutes, a delivery taking 70 minutes has:
Z = (70 − 42) / 8 = 3.5
That is a strong signal to investigate: route issues, vendor delay, address quality, or weather disruptions.
2) Cross-metric comparison in performance reporting
Sales numbers and conversion rates live on different scales. Z-scores allow you to compare “relative performance” across regions. A region might have moderate revenue but exceptionally strong conversion relative to its baseline, which becomes clearer after standardisation.
3) Quality control in manufacturing or service
Z-scores help detect shifts in measurements like weight, thickness, or response time. Even when values remain “within limits,” a growing pattern of high Z-scores can warn that the process is drifting.
4) Fraud and risk screening
Transaction amounts are naturally skewed, but within a peer group (same customer segment, same merchant category, similar time window), Z-scores can highlight unusual spikes that merit verification.
These applications are frequently covered in a data analytics course in Bangalore because they demonstrate how descriptive analytics can become operationally actionable, not just “summary reporting.”
Common pitfalls and how to avoid them
- Non-normal distributions: Z-scores are still computable, but extreme values may be more common in skewed data. Consider segmenting the data or applying transformations (like log scaling) when appropriate.
- Small samples: Mean and standard deviation are unstable with very few points. Use broader windows or robust measures.
- Mixed populations: If you calculate Z-scores across fundamentally different groups (for example, enterprise vs retail customers), you may falsely flag normal behaviour. Compute Z-scores within meaningful segments.
- Over-reliance on thresholds: A high absolute Z-score is a prompt to investigate, not a verdict.
Conclusion
Descriptive analytics helps you understand what your data looks like, how it behaves, and where it deviates from expectations. Z-score calculation strengthens this stage by standardising variables, letting you compare metrics on a common scale and detect unusual values efficiently. When applied with clean data practices and sensible segmentation, Z-scores support faster diagnostics, clearer reporting, and smarter prioritisation of follow-up analysis, skills that translate directly into day-to-day analytics work and are routinely practised in a data analytics course in Bangalore.